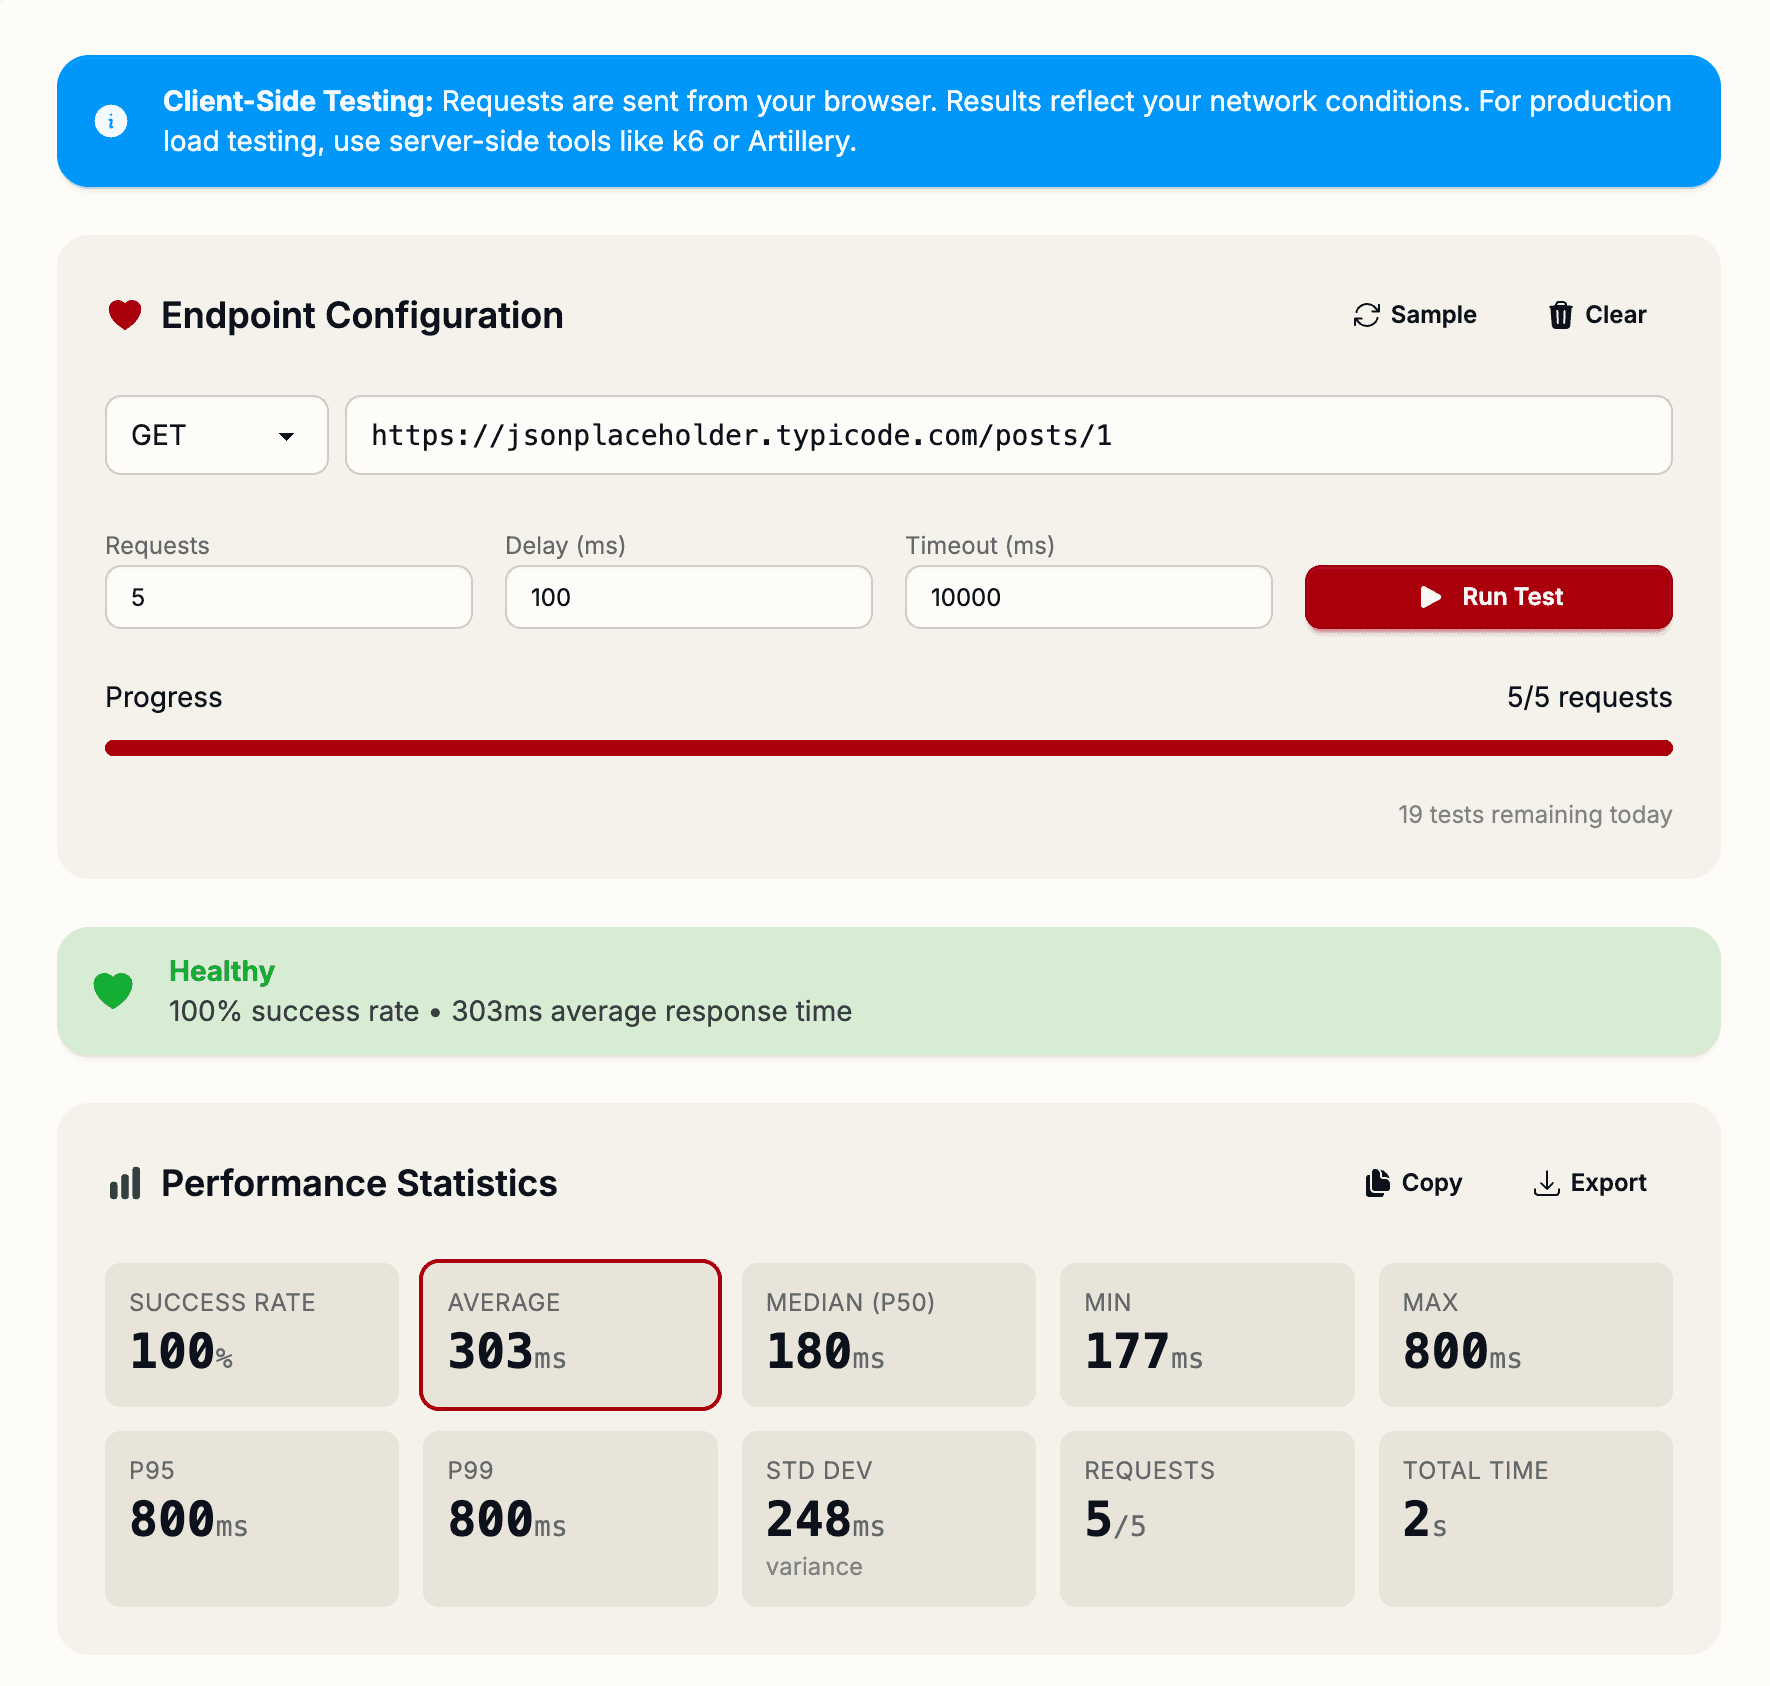
Before deploying an API to production, you need to know how it performs under load. The Endpoint Health Checker lets you run up to 100 sequential requests against any endpoint and get detailed performance metrics—no setup required, no installation needed.
Why Performance Testing Matters
A 200 ms response time feels fine in development. But in production, with thousands of concurrent users, endpoint behavior changes. You might discover:
- Slow database queries — That were fine with test data but choke with production volume
- Resource leaks — Memory increases with each request
- Timeouts — Requests that occasionally fail under load
- Inconsistent performance — High variance between requests suggests caching or GC issues
Catching these issues before they hit production saves hours of debugging and prevents user-facing failures.
The Endpoint Health Checker Solution
The Endpoint Health Checker runs sequential requests against your endpoint and collects comprehensive performance data. Just paste your URL, configure the number of requests (1-100), and let it run.
Configurable Parameters
- Request Count — How many requests to make (default: 10, max: 100)
- Delay Between Requests — Time to wait between requests (default: 100ms, helps avoid overwhelming the server)
- Timeout — How long to wait for a response (default: 10 seconds)
- HTTP Method — GET, POST, PUT, PATCH, DELETE, or HEAD
These settings let you simulate different load scenarios. A 100ms delay mimics real user traffic, while removing delay tests how fast your endpoint can respond when requests arrive rapid-fire.
Performance Metrics Explained
After testing completes, you get eight key metrics:
- Count — Total successful requests (helps spot failures under load)
- Min — Fastest response time (how fast your endpoint can be)
- Max — Slowest response time (worst-case performance)
- Average — Mean response time (typical user experience)
- Median (p50) — Middle value (better than average for skewed distributions)
- p95 — 95th percentile (5% of users experience this or worse)
- p99 — 99th percentile (1% of users hit this threshold)
- Std Dev — Standard deviation (measures consistency—high values indicate erratic performance)
What These Metrics Tell You
If your average response time is 100ms but p99 is 5 seconds, you have a tail latency problem. Some requests are extremely slow, which will frustrate your users even if most requests are fast.
High standard deviation means your endpoint's performance is inconsistent—investigating why some requests are fast and others slow can reveal database issues, cache misses, or server resource contention.
Real-World Testing Scenarios
Before Launch: Run 50 requests with 100ms delay to see how your endpoint behaves with moderate traffic.
Debugging Performance Regression: If users report slowdowns after a deployment, test the endpoint and compare metrics to your baseline.
Database Optimization: After optimizing a slow query, test to confirm improvements (lower average, p99, and standard deviation).
Monitoring Production Health: Periodically test endpoints to catch performance degradation early.
Export Results
Results can be exported as JSON or CSV, perfect for:
- Sharing performance reports with your team
- Tracking metrics over time (monitor for degradation)
- Importing into spreadsheets for trend analysis
- Including in deployment checklists and documentation
Real-Time Progress Visualization
Watch results come in as the test runs. See response times populate in real-time, helping you spot immediate issues (like an endpoint that times out on the 15th request).
Start your first health check at shipmas-advent.com/day/7 — performance insights in seconds. 💓
